
Graphs: Graphing Linear Equations
Lesson Objective
This lesson shows you the steps on plotting
(i.e. graphing) the graph of linear equations.
Why Learn This?
If you are given an equation and have been asked to make sense out of it, very likely you will mentally try to visualize it.
However when the equation gets more complex, you will soon find it difficult to do it mentally. This is where coordinate plane is here to help.
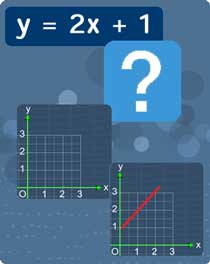
With several simple steps, you will be able to draw out the equation. As a start, we will use a simple straight line equation to demonstrate this purpose.
Note that straight line equation is also called linear equation.
However when the equation gets more complex, you will soon find it difficult to do it mentally. This is where coordinate plane is here to help.
With several simple steps, you will be able to draw out the equation. As a start, we will use a simple straight line equation to demonstrate this purpose.
Note that straight line equation is also called linear equation.
Study Tips
As you watch the math video below, try to remember the following:
 Now, watch the following math video to know more.
Tip #1
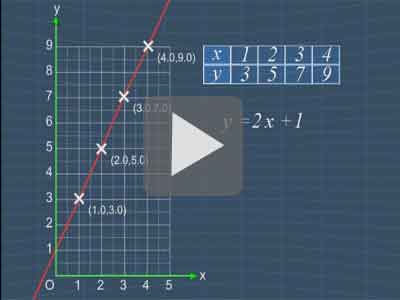
You can draw a x-y table to help you to record
the
coordinates of your points in an orderly manner.
Tip #2
Take note on how the coordinates of each
point are calculated.
Tip #3
Only few points are used to plot the
equation in this lesson. For more
complicated equations, you may need more
points to have a complete picture of the equation.
Math Video
Click Play to Watch
Math Video Transcript
Practice Questions & More
Multiple Choice Questions (MCQ)
Now, let's try some MCQ questions to understand
this lesson better.
You can start by going through the series of questions on graphing linear equations or pick your choice of question below.
You can start by going through the series of questions on graphing linear equations or pick your choice of question below.
- Question 1 on using a linear equation to calculate y-coordinates
- Question 2 on the basics of graphing linear equations